How to use NLP to Analyze WhatsApp Messages
On 17 August 2018, I married the woman of my dreams and wanted to surprise her with a gift the day before the wedding. Of course, as a Data Scientist, I had to communicate that through data!
Our WhatsApp messages seemed like a great source of information. I used NLP to analyze the messages and created a small python package, called SOAN, that allows you to do so.
In this post, I will guide you through the analyses that I did and how you would use the package that I created. Follow this link for instructions on downloading your WhatsApp texts as .txt.
Preprocessing Data
The package allows you to preprocess the .txt file as a specific format is required to do the analyses. Simply import the helper function to both import the data and process it. The import_data is used to import the data and preprocess_data prepares the data in such a way that it is ready for analysis.
from soan.whatsapp import helper      # Helper to prepare the data
from soan.whatsapp import general     # General statistics
from soan.whatsapp import tf_idf      # Calculate uniqueness
from soan.whatsapp import emoji       # Analyse use of emoji
from soan.whatsapp import topic       # Topic modeling
from soan.whatsapp import sentiment   # Sentiment analyses
from soan.whatsapp import wordcloud   # Sentiment-based Word Clouds
%matplotlib inline
df = helper.import_data('Whatsapp.txt')
df = helper.preprocess_data(df)
After preprocessing the data you will have a few columns: Message_Raw, Message_Clean, Message_Only_Text, User, Date, Hour, Day_of_Week. The Message_Raw contains the raw message, Message_Clean only contains the message itself and not the user or date, and Message_Only_Text only keeps lowercased text and removes any non-alphanumeric character:

Exploratory Data Analysis (EDA)
Now that the data is preprocessed, some initial graphs can be created based on the frequency of messages. Call plot_messages to plot the frequency of messages on a weekly basis: general.plot_messages(df, colors=None, trendline=False, savefig=False, dpi=100)
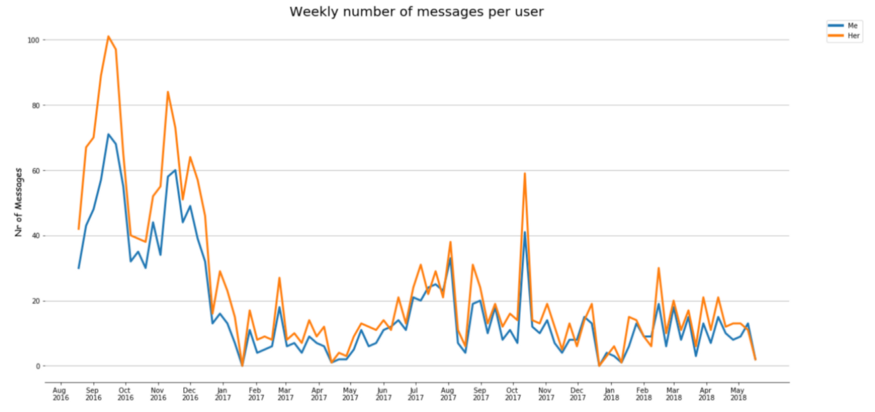
Interestingly, this shows a seemingly significant dip in messages around December of 2016. We moved in together at the time which explains why we did not need to text each other that much. I was also interested in the daily frequency of messages between my wife and me. Some inspiration was borrowed from Github to create a calendar plot (using a modified version of CalMap): general.calendar_plot(df, year=2017, how=’count’, column=’index’)

There are a view days were we texted more often but that does not seem to be a visual observable pattern. Let’s go more in-depth with TF-IDF!
Unique Words (TF-IDF)
I wanted to display words that were unique to us but also frequently used. For example, the word “Hi” might be unique to me (because she always uses the word “Hello”) but if I used it a single time in hundreds of messages it simply will not be that interesting. To model this I used a popular algorithm called TF-IDF (i.e., Term Frequency-Inverse Document Frequency). It takes the frequency of words in a document and calculates the inverse proportion of those words to the corpus:

Basically, it shows you which words are important and which are not. For example, words like “the”, “I” and “an” appear in most texts and are typically not that interesting.
The version of TF-IDF that you see above is slightly adjusted as I focused on the number of words that were texted by a person instead of the number of texts.
The next step is to calculate a uniqueness score for each person by simply dividing the TF-IDF scores for each person:

As you can see in the formula above it takes into account the TF-IDF scores of each person in the chat. Thus, it would also work for group chats.
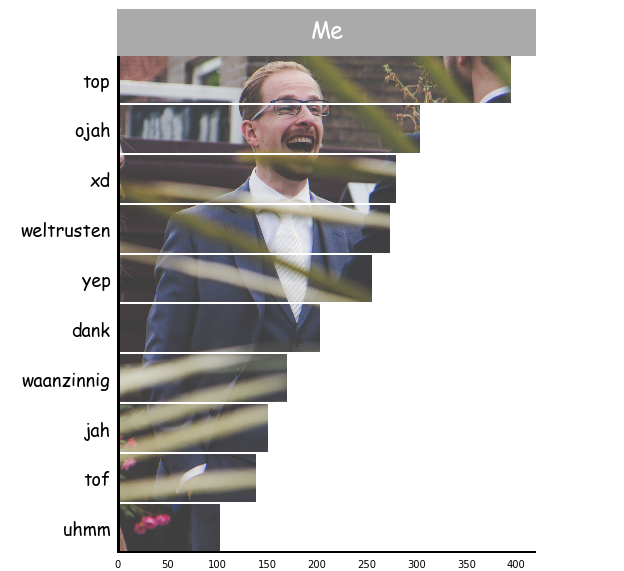
One important thing in doing Data Science is to communicate the results in clear but also a fun and engaging manner. Since my audience was my wife I had to make sure my visualizations were clear. I decided to use a horizontal histogram that would show the most unique words and their scores. Words are typically easier to read in a horizontal histogram. To make it more visually interesting you can use the bars as a mask for any image that you want to include. For demonstration purposes I used a picture of my wedding:
unique_words = tf_idf.get_unique_words(counts, df, version = 'C')
tf_idf.plot_unique_words(unique_words, user='Me',
                         image_path='histogram.jpg', image_url=None,
                         title="Me", title_color="white",
                         title_background='#AAAAAA', width=400,
                         height=500)
Emoji and Sentiment Analysis
The emojis that we use, to a certain extent, can describe how we are feeling. I felt like it would be interesting to apply the formula that you saw previously (i.e., TF-IDF + Unique Words) to emojis. In other words, which emojis are unique to whom but also frequently used?
I can simply take the raw messages and extract the emojis. Then, it is a simple manner of counting the number of emojis and applying the formula:
emoji.print_stats(unique_emoji, counts)
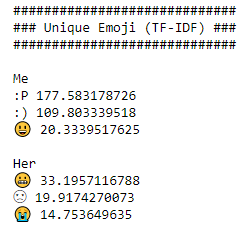
Clearly, my unique emojis are more positive while those of her seem to be on the negative side. This does not necessarily mean that I use more positive emojis. It merely means that her unique emojis tend to be more negative.
A natural follow-up to these analyses would be the sentiment. Are there perhaps dips in the relationship that can be seen through our messages? First, we need to extract how positive messages are. Make sure to create a new column with the sentiment score through:
from pattern.nl import sentiment  as sentiment_nl
df['Sentiment'] = df.apply(lambda row:
                           sentiment_nl(row.Message_Clean)[0], 1)
I decided against putting the sentiment step in the package seeing as there are many ways (and languages) to create the sentiment from. Perhaps you would like to use different methods other than a lexicon based approach. Then, we can calculate the average weekly sentiment and plot the result:
sentiment.plot_sentiment(df, colors=[‘#EAAA69’,’#5361A5'],
                         savefig=False)
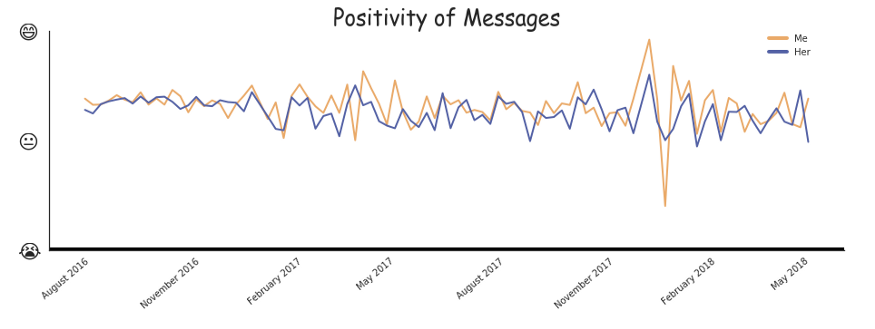
In January of 2018, I was in an accident which explains the negativity of the messages in that period.
Sentiment-based Word Clouds
Word Clouds are often used to demonstrate which words appear frequently in documents. Words that appear frequently are bigger than those that only appear a few times.
To make the clouds more interesting I separated them by sentiment. Positive words get a different cloud from negative words:
(positive,
negative) = wordcloud.extract_sentiment_count(counts,
                                              user = "Me")
wordcloud.create_wordcloud(data=positive, cmap='Greens',
                           mask='mask.jpg',
                           stopwords='stopwords_dutch.txt',
                           random_state=42, max_words=1000,
                           max_font_size=50, scale=1.5,
                           normalize_plurals=False,
                           relative_scaling=0.5)
wordcloud.create_wordcloud(data=negative, cmap='Reds',
                           mask='mask.jpg',
                           stopwords='stopwords_dutch.txt',
                           random_state=42, max_words=1000,
                           max_font_size=50, scale=1.5,
                           normalize_plurals=False,
                           relative_scaling=0.5)
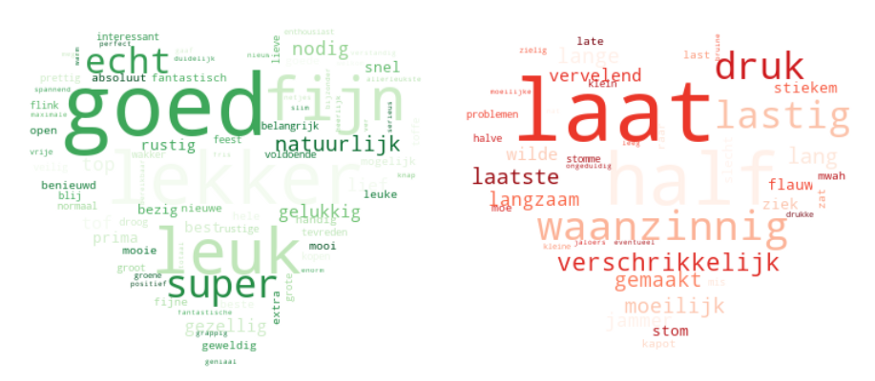
The words were selected based on an existing lexicon in the pattern package. Positive words that we typically used were goed (good) and super (super). Negative words include laat (late) and verschrikkelijk (horrible). It is interesting to see that some words were labeled to be negative that I did not use as such. For example, I typically use waanzinnig (crazy) as very to emphasize certain words.
Topic Modeling
Topic Modeling is a tool that tries to extract topics from textual documents. A set of documents likely contains multiple topics that might be interesting to the user. A topic is represented by a set of words. For example, a topic might contain the words dog, cat, and horse. Based on these words, it seems that the topic is about animals.
I implemented two algorithms for creating topics in SOAN, namely LDA (Latent Dirichlet allocation) and NMF (Non-negative Matrix Factorization). NMF uses linear algebra for the creation of topics while LDA is based on probabilistic modeling. Check this post for an in-depth explanation of the models.
I decided to remove the option to work on the parameters of both models as it was intended to give a quick overview of possible topics. It runs the model for each user separately:
topic.topics(df, model='lda', stopwords='stopwords_dutch.txt')
topic.topics(df, model='nmf', stopwords='stopwords_dutch.txt')
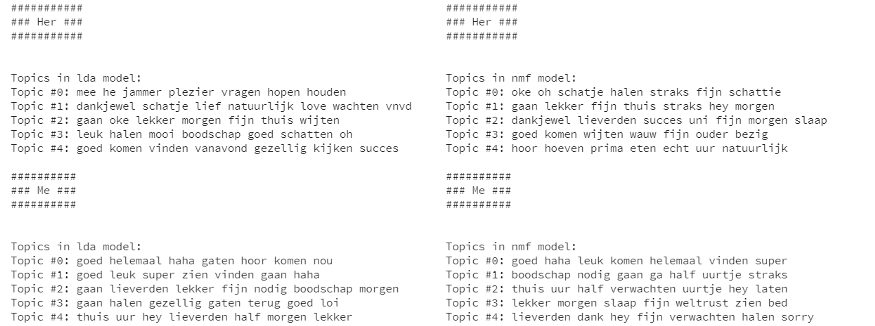
What you can see in the generated topics (if you can read Dutch) is that topics can be found that describe doing groceries. There are also quite some topics that somewhat describe seeing each other the next day or saying good night. This would make sense seeing as most of our messages were sent during the time we did not live together.
The downside of using Topic Modeling is that the user needs to interpret the topics themselves. It also could require parameter tweaking to find quality topics.