How to Detect Bias in AI
Bias in Artificial Intelligence (AI) has been a popular topic over the last few years as AI-solutions have become more ingrained in our daily lives. As a psychologist who switched to data science, this topic is close to my heart.
To prevent making AI models biased, one first has to be aware of the existence of a wide range of biases.
In order to detect bias, one has to be aware of its existence.
To do that, this article will guide you through many common and uncommon biases you can find in different stages of developing AI. The stages are, among others:
-
Data Collection
-
Data Preprocessing
-
Data Analysis
-
Modeling
Hopefully, knowing which biases you might come across will help you in developing AI-solutions that are less biased.
1. What is Bias?

Bias is considered to be a disproportionate inclination or prejudice for or against an idea or thing. Bias is often thought of in a human context, but it can exist in many different fields:
-
Statistics— For example, the systematic distortion of a statistic
-
Research—For example, bias towards the publication of certain experimental significant results
-
Social sciences — For example, prejudice against certain groups of people
In this article, we will combine several fields in which (cognitive) biases could appear in order to understand how biases could find its way into Artificial Intelligence.
Below, I will go through common stages of AI development and identify steps to detect where bias may be found.
2. Data Collection

Data collection is the first and one of the most common places where you will find biases. The biggest reason for this is that data is typically collected or created by humans which allows for errors, outliers, and biases to easily seep into the data.
Common biases found in the data collection process:
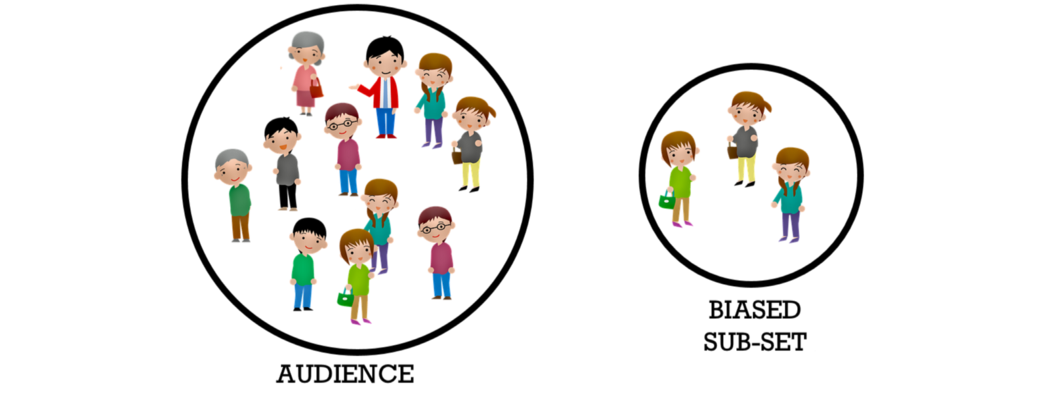
- Selection Bias— The selection of data in such a way that the sample is not representative of the population
For example, in many social research studies, researchers have been using students as participants in order to test their hypotheses. Students are clearly not representative of the general population and may bias the results found.
- The Framing Effect — Survey questions that are constructed with a particular slant.
As seen below, people are more likely to save a guaranteed 200 lives compared to a 33% chance of saving everyone, if the question was framed positively.

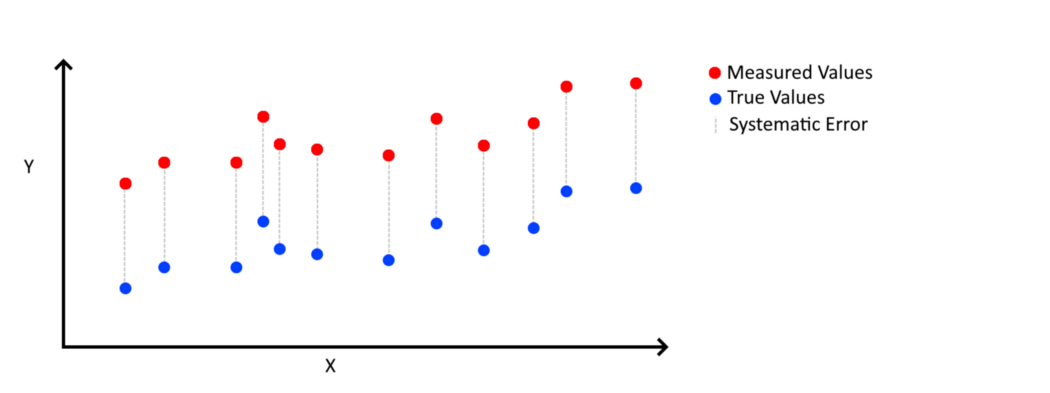
- Systematic Bias— This is a consistent and repeatable error.
This is often the result of faulty equipment. Correcting this error is important as the error is difficult to detect. A good understanding of the machinery or process is necessary.
- Response Bias - A range of biases in which participants respond inaccurately or falsely to questions.
The response bias is often seen in questionnaires. Since these are filled out by participants, human bias easily finds its way in the data. For example, the Social Desirability Biasstates that people are likely to deny undesirable traits in their responses. This could be by emphasizing good behavior or understating bad behavior. Similarly, the Question Order Bias states that people may answer questions differently based on the order of the questions.
It is important to understand that how you design the collection process could heavily impact the kind of data you will be collecting. If not careful, your data will be strongly biased towards certain groups. Any resulting analyses will likely be flawed!
3. Data Preprocessing
When processing the data, there are many steps one can take in order to prepare it for analyses:
- Outlier Detection
You typically want to remove outliers as they might have a disproportionate effect on some analyses. In a dataset where all people are between 20 and 30 years old, a person with an age of 110 is likely to be less representative of the data.
- Missing Values
How you deal with missing values for certain variables can introduce bias. If you were to fill in all missing values with the mean, then you are purposefully nudging the data towards the mean. This could make you biased towards certain groups that behave closer to the mean.
- Filtering Data
I have seen this happen many times where data is filtered so much, that it is hardly representative anymore of the target population. This introduces, in a way, Selection Bias to your data.
4. Data Analysis

When developing an AI solution, the resulting product could be a model or algorithm. However, bias can just as easily be found in data analysis. Typically, we see the following biases in data analyses:
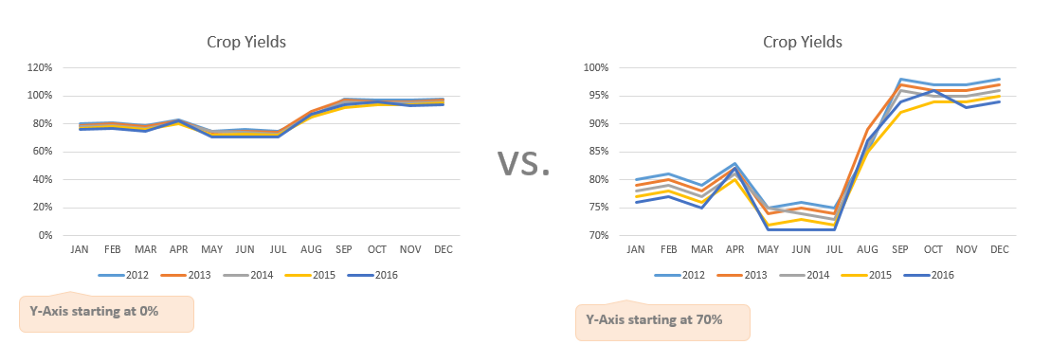
- Misleading Graphs— A distorted graph that misrepresents data such that an incorrect conclusion may be derived from it.
For example, when reporting the results of an analysis, a Data Scientist could choose to start the y-axis of his graph at 0. Although this does not introduce bias in the data itself, there could be obvious Framing as the differences appear to be more pronounced (see image below).
If you want to know more about the effects of Misleading Graphs, the book “How to Lie with Statistics” is highly recommended!
- Confirmation Bias — The tendency to focus on information that confirms one’s preconceptions.
Let’s say you believe that there is a strong relationship between cancer and drinking wine. When performing your analysis you only search to confirm this hypothesis by not considering any confounding variables.
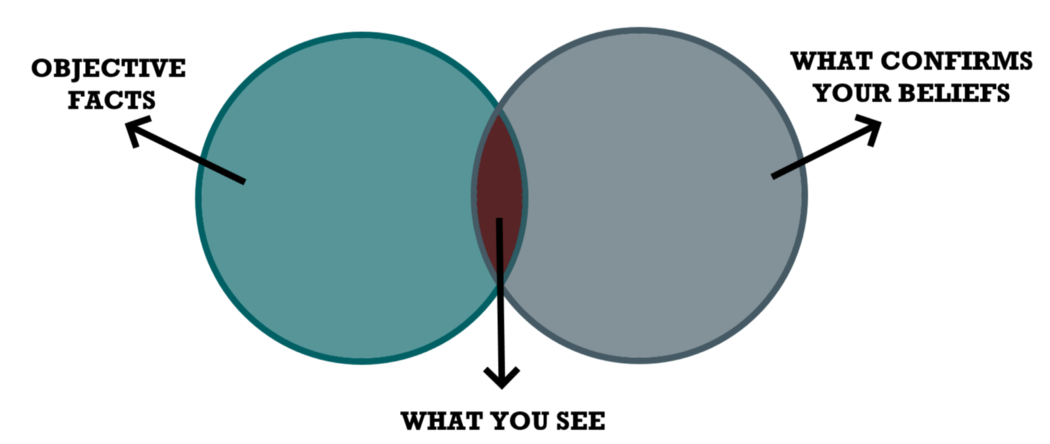
This might seem like an extreme example and something you would never do. But the reality is that humans are inherently biased and it is difficult to shake that. It happened to me more often than I would like to admit!
5. Modeling
When talking about bias in AI, people typically mean an AI-system that somehow favors a certain group of people. A great example of this is the hiring-algorithm **Amazon created which showed Gender Bias in its decisions. The data they used for this algorithm consisted mostly of males in technical roles which led it to favor men as high potential candidates.
This is a classic example of the Garbage-in-Garbage-out Phenomenon in which your AI-solution is only as good as the data you use. That is why it is so important to detect bias in your data before you start modeling the data.
Let’s go through several types of biases you often see when creating a predictive model:
- Bias/Variance Trade-Off— The trade-off between bias (underlying assumptions of the model) and variance (the change in the prediction if different data is used).
A model with high variance will focus too much on the train data and does not generalize well. High bias, on the other hand, assumes that the data always behave in the same way, which is seldom true. When increasing your bias, you typically lower your variance and vice-versa. Thus, we often seek to balance bias and variance.

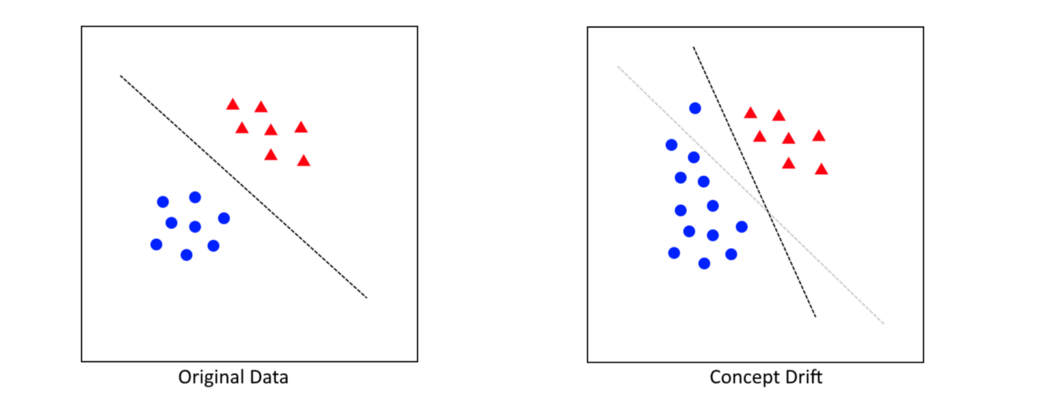
- Concept Drift — The phenomenon in which the statistical properties of the target variable change over time in unforeseen ways.
Imagine you created a model that could predict the behavior of customers in an online shop. The model starts out great, but its performance diminishes a year later. What happened is that the behavior of customers has changed over the year. The concept of customer behavior has changed and negatively affects the quality of your model.
The solution could simply be to retrain your model frequently with new data in order to be up-to-date with new behavior. However, an entirely new model might be necessary.
- Class Imbalance— An extreme imbalance in the frequency of (target) classes.
Let’s say you want to classify whether a picture contains either a cat or a dog. If you have 1000 pictures of dogs and only 10 pictures of cats, then there is a Class Imbalance.
The result of class imbalance is that the model might be biased towards the majority class. As most pictures in the data are of dogs, the model would only need to always guess “dogs” in order to be 99% accurate. In reality, the model has not learned the difference between pictures of cats and dogs. This could be remedied by selecting the correct validation measure (e.g., balanced accuracy or F1-score instead of accuracy).
6. What is next?
After reading about all these potential biases in your AI-solution, you might think:
“But how can I remove bias from my solution?” — You
I believe that to tackle bias, you need to understand its source. Knowing is half the battle. After that, it is up to you figure out a way to remove or handle that specific bias. For example, if you figured out that the problem stems from selection bias in your data, then it might be preferred to add additional data. If class imbalance makes your model more biased towards the majority group, then you can look into strategies for resampling (e.g., SMOTE).
NOTE: For an interactive overview of common cognitive biases, see this amazing visualization.